Two Fixes, 3.8x Faster: Caching and DataLoader on a Legacy GraphQL Service
I was scrolling through Elastic the way I do most mornings, and there it was again. The same GraphQL service, the same red P99 chart. It had been like that forever. The kind of slowness you stop seeing.
Nobody had complained that week. I just decided I’d had enough of looking at it.
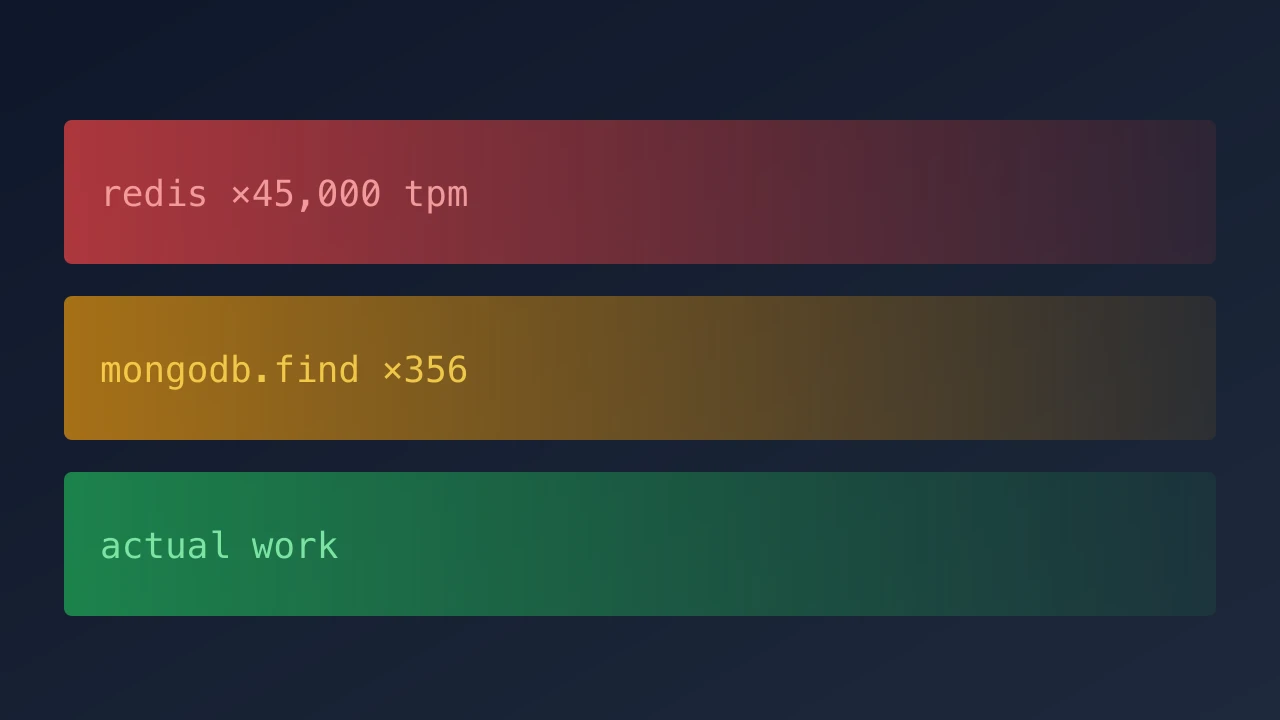
Three days later, and about three hours of actual code, the service was 3.8× faster. P99 went from ~1.3s to ~340ms. Redis traffic dropped from ~45K transactions per minute to ~1.1K. Two fixes, both textbook. The interesting part is everything in between.
What I was looking at
The service is a GraphQL federation subgraph: MongoDB on the read path, Redis for caching, a handful of client apps talking through a federated gateway. Nothing exotic. Inherited code, not greenfield.
The caching lived in a class called GenericDataSource. Every resolver used it the same way: check Redis, on a miss fetch from MongoDB, write back. Sensible at the resolver level. A different problem across a resolver tree.
get = async ({ controllerFn, args, ttlInSeconds }) => {
  const cacheKey = buildKey(controllerFn.name, args);

  const cached = await this.cache.get(cacheKey);
  if (cached) {
    return JSON.parse(cached);
  }

  const doc = await controllerFn({ ...context, ...args });

  await this.cache.set(cacheKey, JSON.stringify(doc), { ttl });
  return doc;
};
The first trace I opened told me almost nothing, and that was the first signal. Too many spans for too little reason. Dozens of Redis GETs stacked on top of each other before MongoDB even showed up. I didn’t have a theory yet, just a vague feeling that this was more work than the query should be doing.
GraphQL queries resolve a tree: a parent entity, its children, each child’s children. Every node went through GenericDataSource.get, and every node issued its own Redis GET. On a cold cache, a single incoming request triggered dozens of round-trips before any data was fetched. ~45K Redis TPM, P99 at 1.3 seconds, and traces so dense with cache overhead that the MongoDB calls were invisible underneath.
The first idea that didn’t work
My first instinct was the boring one: batch the GETs. Redis supports MGET natively. Collect the keys for a request, fire one round-trip, parse the array. I tried it. It worked. The numbers moved a little.
They didn’t move enough.
And the more I thought about scaling it, the worse it looked. A single Redis reply comes back as one string before you parse it, and Node has a hard ceiling: buffer.constants.MAX_STRING_LENGTH, roughly 512MB on most builds. A batch big enough to flatten round-trip count was a batch big enough to put us one bad query away from a process crash. Making MGET safe meant bounding the batch, which meant more round-trips. Exactly the problem I was trying to solve.
So I backed out. The fix needed to live somewhere else entirely.
Caching the whole response
If the resolver tree was the source of the noise, the answer was to stop caching inside it. Cache the serialized response. One Redis GET on the way in. One GET plus one SET on a miss. The shape of the tree stops mattering.
It’s a small Apollo Server plugin that hooks two points of the request lifecycle:
// responseForOperation: return early if we have a cached response
async responseForOperation(requestContext) {
  const key = buildCacheKey(requestContext);
  if (!key) return null;

  const cached = await cache.get(key);
  if (!cached) return null;

  requestContext.metrics.responseCacheHit = true;
  return {
    http: requestContext.response.http,
    body: { kind: "single", singleResult: JSON.parse(cached) },
  };
},

// willSendResponse: write to cache on the way out (misses only)
async willSendResponse(requestContext) {
  if (requestContext.metrics.responseCacheHit) return;

  const key = buildCacheKey(requestContext);
  if (!key) return;

  const { body } = requestContext.response;
  if (body.kind !== "single") return;
  if (body.singleResult.errors?.length > 0) return;

  await cache.set(key, JSON.stringify(body.singleResult), { ttl });
},
The cache key is a hash over the normalized query text, operation name, variables (stable-stringified), and request-scoped identifiers that affect the response shape. Normalizing with parse + print means whitespace differences don’t generate separate entries.
When this kind of caching doesn’t work
If your consumers send wildly different field selections every time, response-level caching just fills Redis with one-shot entries and buys you nothing. If your data changes faster than your TTL, you serve stale answers.
This worked here because of who was calling the service: a small, known set of client apps with a predictable set of query shapes. Low entropy, high repetition, naturally high hit rate. Invalidation is just TTL, twenty minutes, no event-driven busting, because the content is educational material on a publishing cadence. Know your traffic before you reach for this.
I rolled it out cautiously. The consumer teams ran on staging for a working day so we could confirm nothing had changed about the responses they actually received. Then a production deploy at low traffic.
The Redis graph told the story before the latency chart did.
 Redis before: ~45K transactions per minute at peak, ~40K in the moment captured here. The caching layer was generating more traffic than the database it was supposed to protect.
 Redis after: ~1.1K transactions per minute, 4.8ms average. Same service, same traffic, one plugin in between.
~45K transactions per minute down to ~1.1K. A 98% reduction from one plugin.
Where I almost stopped
I thought I was done. The Redis graph was clean. P99 had dropped. If I’d shipped a one-paragraph Slack update and moved on, nobody would have noticed.
What pulled me back was a habit, not a hunch. I sorted the APM by impact: transactions per minute times average latency, a rough proxy for “where is the user time actually going.” One query was still ugly. The response cache had hidden it, not solved it.
So I opened the trace for that query. With the Redis spans gone, I could finally read it.
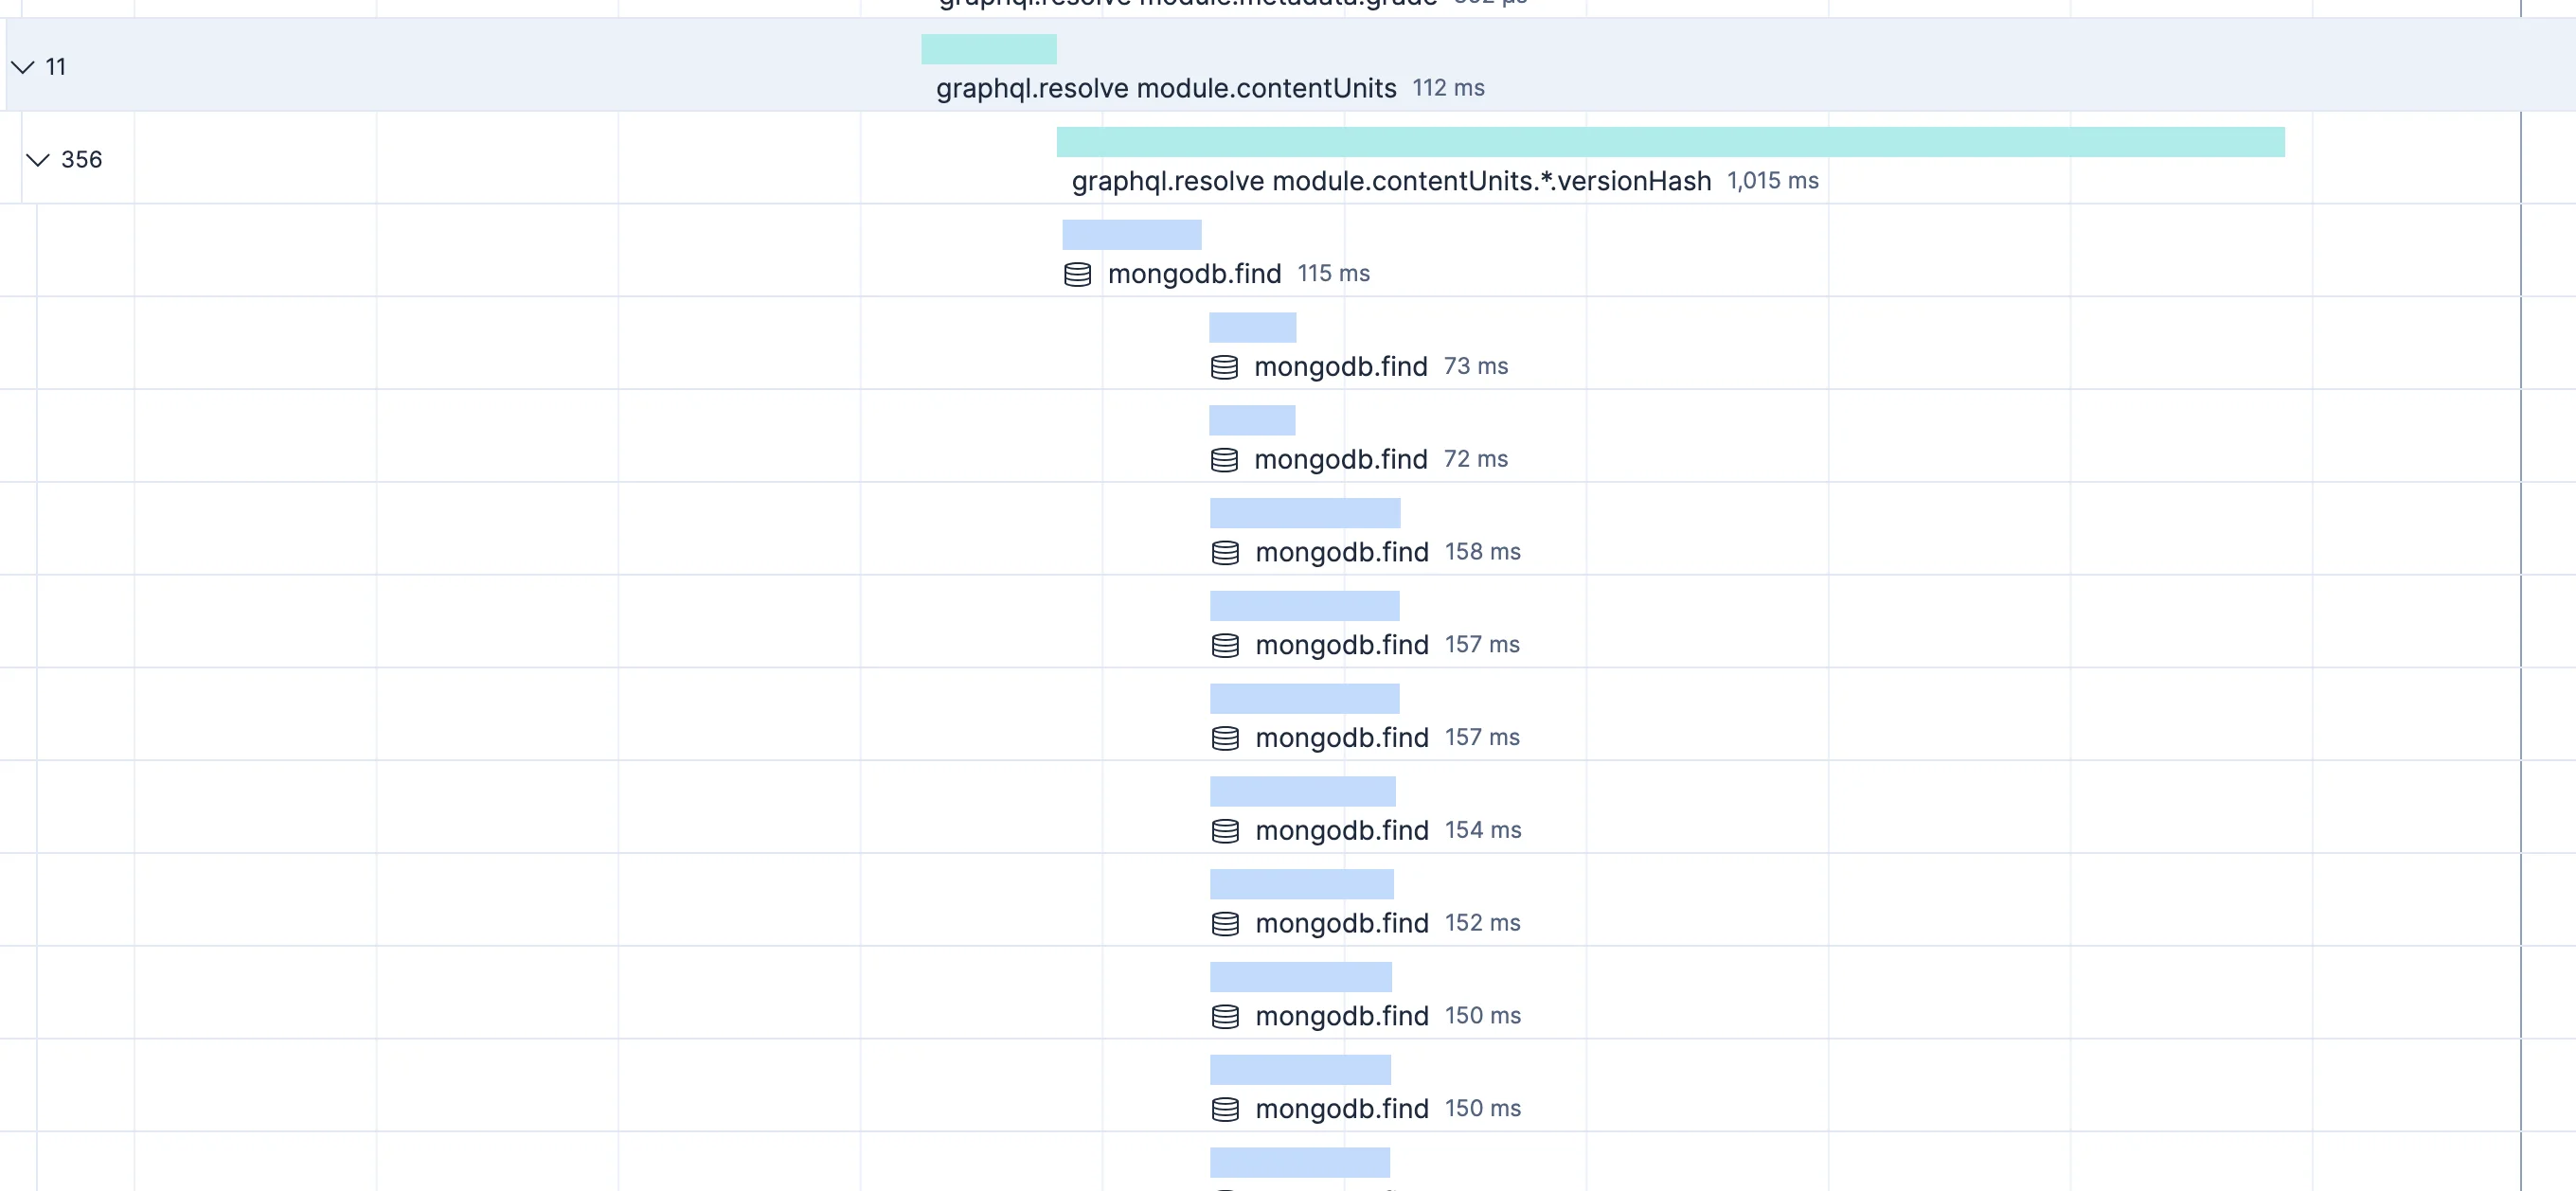 356 individual
 mongodb.find calls. One request. One resolver.
One resolver, 356 sequential MongoDB queries, computing a version hash over a tree of nested resources. An N+1, two levels deep, sitting in a for-loop with an await inside it:
// Before: N+1 in the version hash resolver
for (const child of children) {
  const items = await dataSource.get({
    args: { parent: child },
    controllerFn: fetchChildItems,
  });
  // ...collect version metadata from each item
}
The N+1 had always been there. The first fix made it visible by removing the noise.
DataLoader, the obvious second move
The shape of this problem has been solved since 2016: DataLoader. Collect every key requested in a single event-loop tick, deduplicate, fire one batched query per layer. Round-trip count drops from O(tree size) to O(depth).
async (keys: readonly VersionKey[]) => {
  // 1. Collect all child IDs across the entire batch, deduplicate
  const allChildIds = [...new Set(keys.flatMap((k) => k.children ?? []))];

  // 2. One query: fetch all children with a projected $in
  const childDocs = allChildIds.length > 0
    ? await store.getChildVersionData(allChildIds)
    : [];
  const childById = new Map(childDocs.map((c) => [c.id, c]));

  // 3. Collect all sub-item IDs across all fetched children, deduplicate
  const allItemIds = [...new Set(childDocs.flatMap((c) => c.items ?? []))];

  // 4. One query: fetch all sub-items with a projected $in
  const itemDocs = allItemIds.length > 0
    ? await store.getItemVersionData(allItemIds)
    : [];
  const itemById = new Map(itemDocs.map((p) => [p.id, p]));

  // 5. Reassemble per key: build a tree, stable-serialize, SHA-256 hash
  return keys.map((key) => buildHashFromLookups(key, childById, itemById));
};
The resolver collapsed to one line:
// After: the resolver delegates everything to the DataLoader
const hash = await context.dataloader.entityHash.load({
  id: entity.id,
  version: entity.metadata?.version,
  children: entity.children,
});
356 queries became 2. The Set deduplication means that if multiple entities share children, those IDs appear once in the $in clause. Batching across the request, not just within a single key.
Why the order mattered
Either fix alone would have looked like a small win. The response cache without the DataLoader would have left cold-cache requests crawling under the N+1. The DataLoader without the response cache would have run inside 45,000 Redis round-trips per minute and gone unnoticed.
The first fix paid for itself, and it paid for the second one by making the trace legible. Week before versus week after, weekly-average P99 across all traffic:
- P99 latency: ~1.3s → ~340ms (~3.8× faster)
- Redis transactions per minute: ~45K → ~1.1K
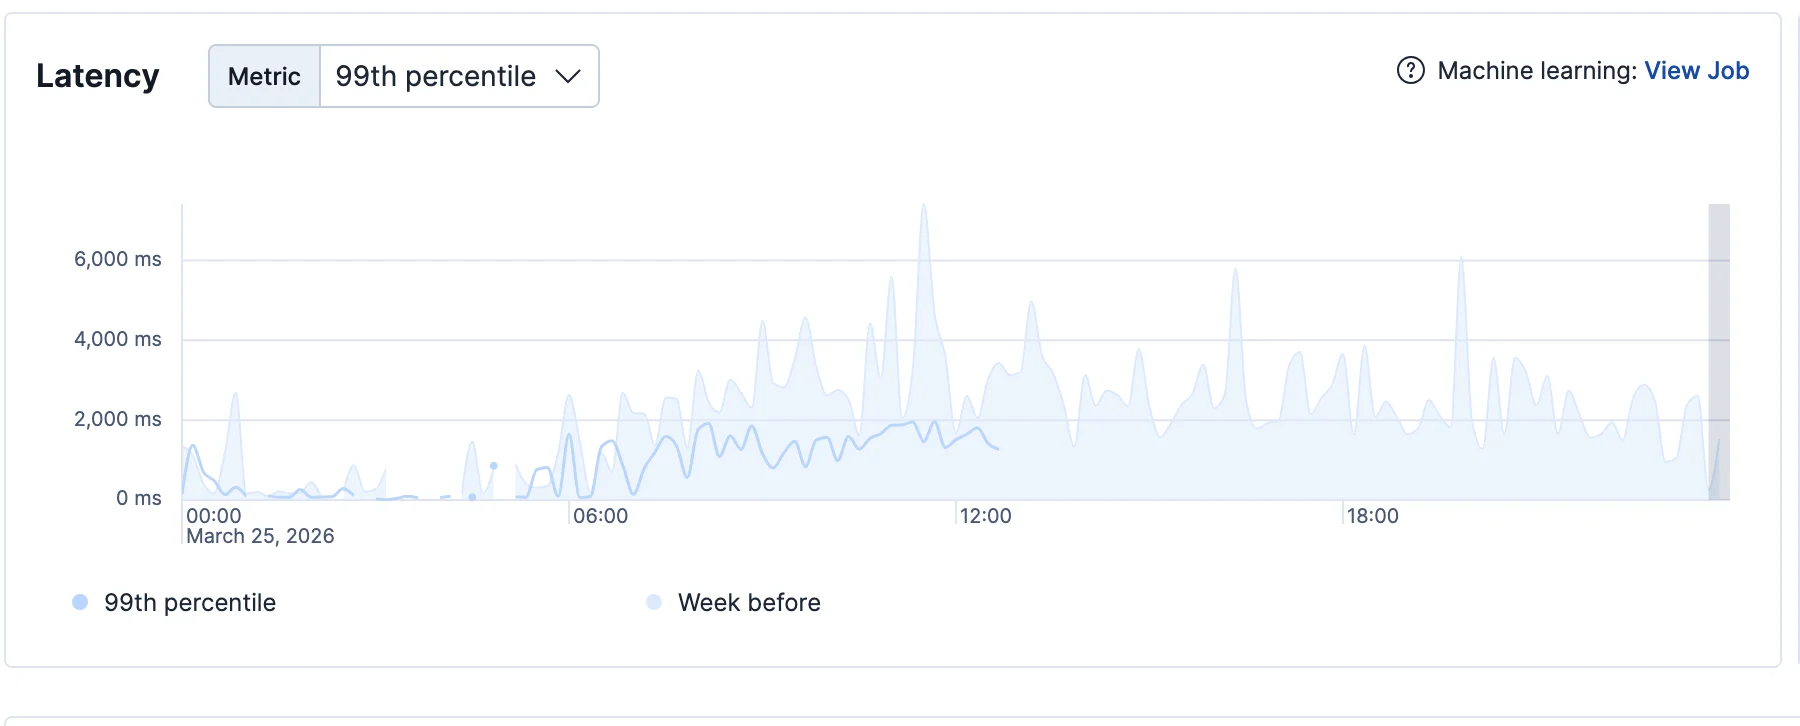 P99 latency: light line is the week before, dark line is after both fixes.
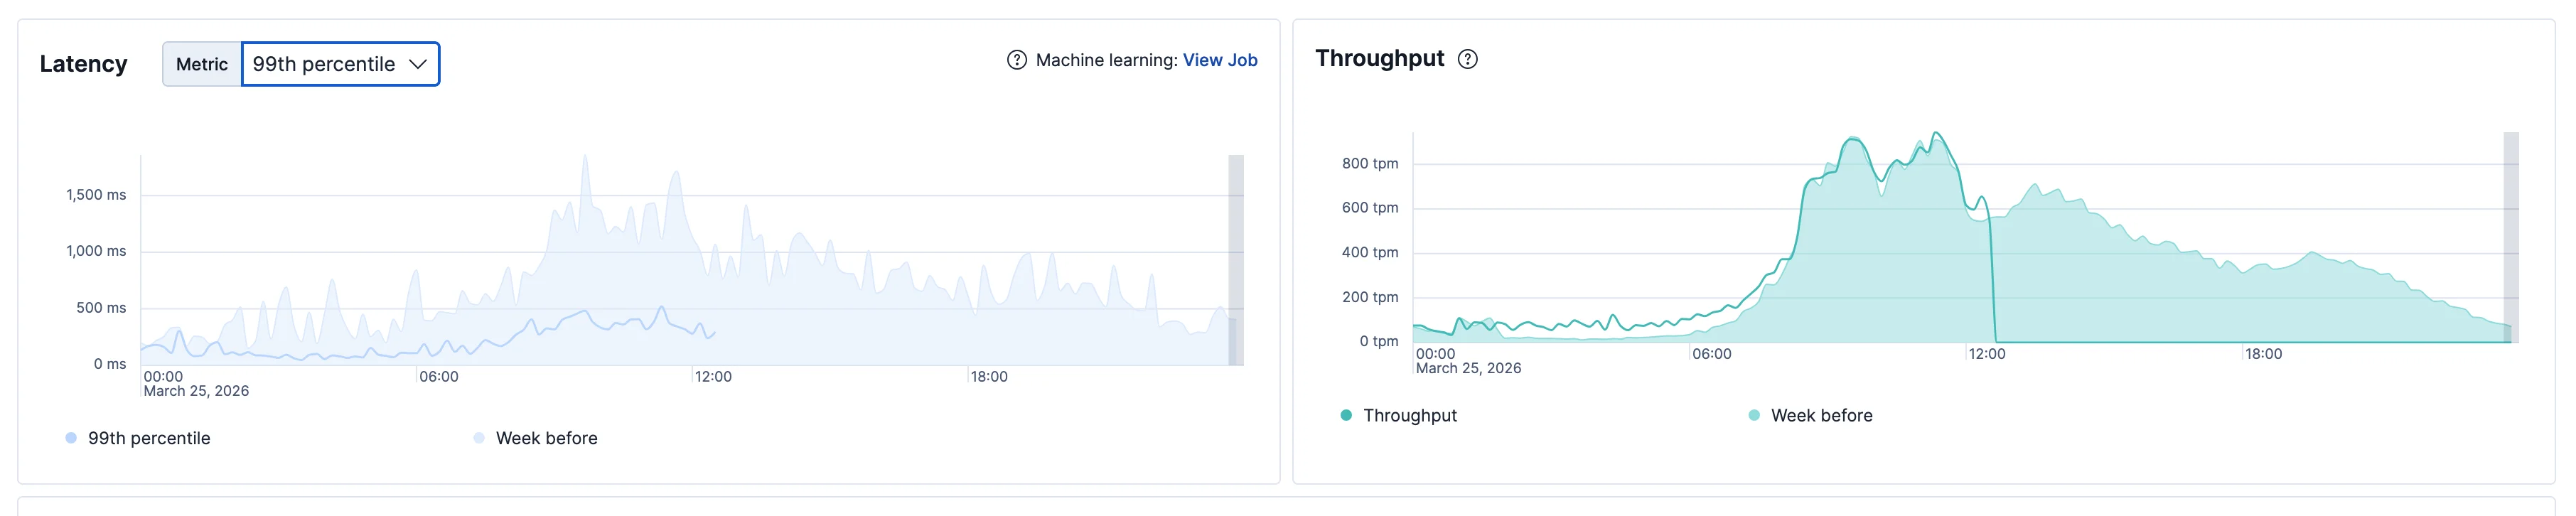 Peak P99 after both fixes. Even on the worst traffic spikes the ceiling is now ~1,500ms.
What I took away
Neither fix is novel. Apollo response caching is a solved problem. DataLoader has been around for a decade. The code I wrote was about fifty lines, and it took three hours once I knew where it belonged.
The interesting part wasn’t the patterns. It was that the right patterns had been sitting in the wrong layer the entire time. A service everyone had stopped questioning turned out to be a three-hour fix wearing a three-day investigation.
Half the time the fix is a known pattern, you just have to figure out where it actually belongs.
The other thing this reinforced: when a service has been slow forever, the dashboards lie by omission. Open a trace first.
Written by